This work is based on my master thesis in Electrical Engineering / Biomedical Engineering done in 2015.
Doi: https://doi.org/10.1016/j.cmpb.2017.08.009
Author names and affiliations
Andriy Guilherme Krefer (1)
Maiko Min Ian Lie (1)
Gustavo Benvenutti Borba (2)
Humberto Remigio Gamba (1)
Marcos Dinís Lavarda (2)
Mauren Abreu de Souza (2)
(1) Graduate School on Electrical Engineering – CPGEI, Department of Electronics – DAELN, Federal University of Technology – Paraná – UTFPR, Curitiba, Paraná, Brazil.
(2) Graduate School on Biomedical Engineering – PPGEB, Department of Electronics – DAELN, Federal University of Technology – Paraná – UTFPR, Curitiba, Paraná, Brazil.
Concise abstract
This work presents a method for generation of 3D thermal models that allows combination of separately acquired 3D mesh and thermal images. Among the advantages of this decoupling are increased modularity of acquisition procedures and reuse of legacy equipment and data. Unlike previous methods, it is considered that the 3D mesh and the thermal images are acquired separately, so camera pose estimation is required to determine the correct spatial positioning from which to project the images. As thermal images of human skin are predominantly homogeneous, an intensity transformation is proposed to increase the efficacy of interest point detection and make the approach feasible. For validation of the method, the design and implementation of a test object is presented. It can be used to validate other methods and can be reproduced with common printed circuit board manufacturing processes. The proposed approach is accurate, with an average displacement error of 1.41 mm (s = 0.74 mm) with the validation test object and 4.58 mm (s = 2.12 mm) with human subjects.
Keywords: Multi-modality imaging, 3D thermography, Structure from Motion, Scale Invariant Feature Transform
Table of Contents
- 1. Introduction
- 2. Proposed Method
- 3. Heat Texture Test Object
- 4. Results
- 5. Discussion
- 6. Conclusions
1. Introduction
Infrared thermography is a technique that allows estimating the temperature of an object from its infrared emission. As every object with temperature above the absolute zero emits infrared radiation, this sensing modality is widely applicable and has been adopted in contexts such as generation of photorealistic models of architectural monuments [1], industrial inspection [2], clothing design [3], among many others [4]. One application domain of particular interest is medical diagnosis, where the contactless, non-invasive and fast measurements of infrared thermography are especially desirable. There are several applications of thermography in medical diagnosis, ranging from sports medicine, in which pre and post-activity temperatures are monitored to diagnose thermoregulatory abnormalities [5, 6], to cancer diagnosis, in which, for instance, temperature is monitored over time to distinguish benign and malign pigmented lesions [7, 8, 9]. In fact, any condition that influences skin surface temperature can benefit from infrared thermography analysis, including tuberculine reaction [10], stress [11], not to mention blunt trauma and other forensic applications such as time of death estimation [12].
Another sensing modality that has been increasingly adopted in medical applications is 3D scanning (i.e. range imaging). It allows shape and size measurements while sharing the above mentioned conveniences of infrared thermography [13]. Among its medical applications are deformity detection, skin analysis [13] and plastic surgery planning [14]. 3D models also allow 3D printing – the production of haptic physical models by addition of physical layers – which can be used for treatment planning, training, construction of customized prosthetics, among other applications [15, 16].
Considering the similar advantages and complementary measurement information of 2D thermography and 3D scanning, several approaches for their combined application have been proposed [17, 18, 19, 20]. This multi-modality sensing method – 3D thermography – enhances temperature analysis with geometrical information and vice-versa, improving, for instance, diagnosis of Diabetic Foot Disease (DFD) which involve monitoring both blood circulation (i.e. temperature) and ulcer evolution (i.e. surface shape) [18]. Existing 3D thermography approaches are mostly based on the integration of a thermal camera and a 3D scanner in a single instrument by affixing them in the same structural support – a stand [17, 18, 19] or a hand-held mechanism [20]. The former approach is more common in medical diagnosis settings, where the environment is more easily controlled and precise data acquisition guidelines can be employed [21]. The latter is usually applied in industrial settings [20], where the environment has a fixed configuration and the sensing device must adequate itself to its constraints. The aforementioned methods are characterized by the simultaneous acquisition of both 2D thermal and 3D range data. This offers the advantage of straightforward data combination as both sensing devices can be calibrated together, however, the necessity of simultaneous acquisition is also a significant limitation.
This paper presents a 3D thermography method for medical applications, which is based on the projection of a series of thermal images over a 3D mesh, generating a 3D thermal model – without the necessity of simultaneous acquisition of 2D and 3D data, unlike previous methods. Among the advantages of this decoupling are modularization of the acquisition procedures and the possibility of legacy equipment reuse. As 3D scanning technologies expand a wide range of accuracy/cost trade-off and different sensing modalities can be offered by different clinics, a decoupled and more modular acquisition process allows easy adaption to different time and cost circumstances. Moreover, this approach also allows reuse of previously acquired data, as long as adequate data acquisition guidelines are followed to maintain similar acquisition conditions.
The projection of thermal images over a 3D mesh, in methods that acquire data from both sensing modalities simultaneously, is trivial [18]. On the other hand, camera pose estimation is required when data acquisition is decoupled, as is the case in this work. This is done using Structure from Motion (SfM), which requires a series of interest point matches between images from different perspectives [22]. Due to the low-resolution and homogeneous aspect of thermal images, which hinders interest point detection, this approach has been unexplored in thermography. To address this, an image intensity transformation is presented, which significantly improves interest point detection in thermal images and allows a sufficient number of matches for adequate camera pose estimation. The thermal images are projected from the estimated poses over the 3D mesh, which is aligned through an optimization model solved via Particle Swarm Optimization (PSO), resulting in the final 3D thermal model.
A validation of the method is presented using a test object, called Heat Texture Test Object (HTTO), for which the motivation, design and evaluation is also described. Additionally, a case study with human subjects, with quantitative evaluation, is presented to demonstrate the applicability of the method in the context of medical diagnosis. The results show that the approach successfully generates accurate 3D thermal models, presenting average displacement error of 1.41 mm (s = 0.74 mm) for the test object and 4.58 mm (s = 2.12 mm) for the
human subjects.
The remainder of this paper is organized as follows. Section 2 shows a general overview of the proposed method, followed by a detailed explanation of its stages. Section 3 describes the design and implementation of the HTTO, including the experiments used to determine its adequate characteristics. Section 4 presents qualitative and quantitative evaluation of the proposed method on the HTTO and on human subjects, with a discussion of the obtained results. Section 6 concludes this work, indicating future improvements and research directions.
2. Proposed Method
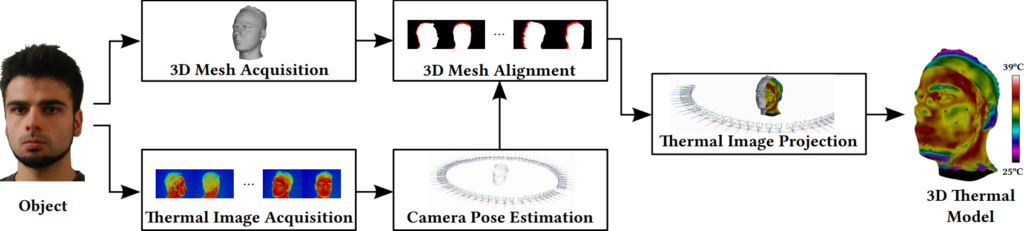
The proposed method is capable of projecting 2D thermal images of an object onto its respective 3D mesh, which does not need to be acquired simultaneously with the thermal images. Figure 1 describes the main steps of the proposed method, which are detailed as follows.
2.1. 3D Mesh Acquisition
For the acquisition of the 3D mesh, a Creaform 3D Gemini scanner was used – it has a resolution of 0.4 mm in the X and Y axes and of 0.2 mm in the Z axis.
The manufacturer’s recommendation is for the acquisition to be made from a distance of approximately one meter from the object [23]. To obtain the complete mesh, the acquisition must be made from several angles. The respective patches are registered to form a single 3D object using the ICP (Iterative Closest Point) algorithm [24] through the Geomagic software.
2.2. Thermal Image Acquisition
For the acquisition of the thermal images, a FLIR infrared camera model A325 was used. It is sensitive to wavelengths of 7.5 to 13 μm and can record temperatures from -20 to 120 °C with a thermal resolution of 0.05 °C, at 30 frames per second with a resolution of 320×240 pixels [25]. The lens used has a nominal focal length of 18 mm.
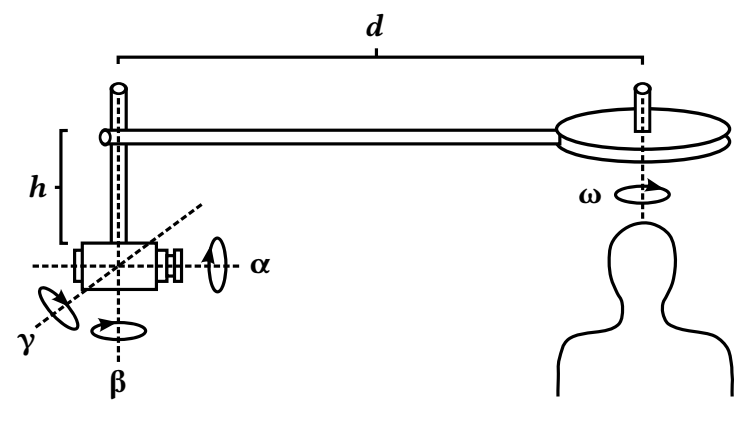
During the thermography experiments, it was observed that long periods in the acquisition of the images caused significant temperature variations on the skin surface. To address this, a rotating system (Figure 2) was designed and assembled to allow faster and more accurate acquisition of the thermal images.
The system provides adjustment of distance d, height h, and angulation of the thermal camera (i.e. α, β, θ and γ). A motor with speed control coupled to the rotation axis ω (ranging from 0 to 360°) allows capturing images at multiple angles while maintaining a fixed distance d to the object. The acquisition of all thermal images was conducted in a room with an especially built air-conditioner that allows control of temperature and humidity variations, and air circulation.
The acquired sequence of thermal images is exported to the CSV (Comma Separated Values) format using the FLIR Tools 4.0 software. Obtained values are expressed in degrees Celsius, with each value representing a pixel of the image. CSV files are then converted to PNG image format using MATLAB. A selection of 70 thermal images, captured at uniformly spaced angles and fixed distance from the object, was adopted for projection onto the 3D mesh.
2.3. Camera Pose Estimation
Structure from Motion (SfM) is a process that simultaneously estimates the 3D structure of an object and the camera poses during image acquisition. In general, Bundle Adjustment (BA) is used for this purpose [26], while SfM is a more general term that aggregates the whole set of techniques used. Since thermal images typically have a low resolution and do not actually describe geometry information, the 3D structure output from SfM is not accurate or reliable enough for our purposes. Consequently, the 3D structure is acquired from a 3D scanner,
as described in Section 2.1, while SfM is used only for camera pose estimation. For this purpose, a minimal number of correspondences between image points, acquired from multiple viewpoints, is required. These correspondences are obtained using detection, description and matching of interest points in these images.
Thermal images of human skin do not have as much details as their corresponding visible light images. There are no abrupt variations in temperature, thus, they tend to be more homogeneous [27]. This characteristic makes the detection and matching of interest points difficult [18, 28, 29]. Considering this, and the fact that SfM was originally designed for visible light images, a pre-processing step was devised to adequate thermal images for this process. A transformation m(T) is proposed on the intensity levels T of the thermal image (normalized in the [0, 255] range), in order to increase the number of regions with high-contrast texture and, consequently, the number of interest points detected. The transformation m(T) is described in Equation 1:
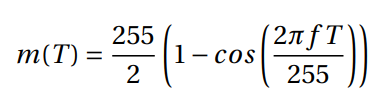
in which f is an adjustable parameter that is determined empirically for our experiments (f = 3.5). This transformation creates artificial contrasts in the intensity levels of the image, emphasizing variations that were previously too subtle to be detected, consequently, increasing the number of interest points detected. At first, the usefulness of such artificial variations might seem dubious for interest point matching, given that images captured at different instants and from different perspectives will hardly maintain the same intensities for the corresponding locations – making these additional interest points poor candidates for matching. However, even though this is the case for visible light images, it is not the case for thermal images. The effect of illumination in the acquisition of different images is irrelevant for thermal images, since it does not cause any significant variation in temperature. Thus, even though the transformation described in Equation 1 creates artificial contrasts, it does not have any significant negative
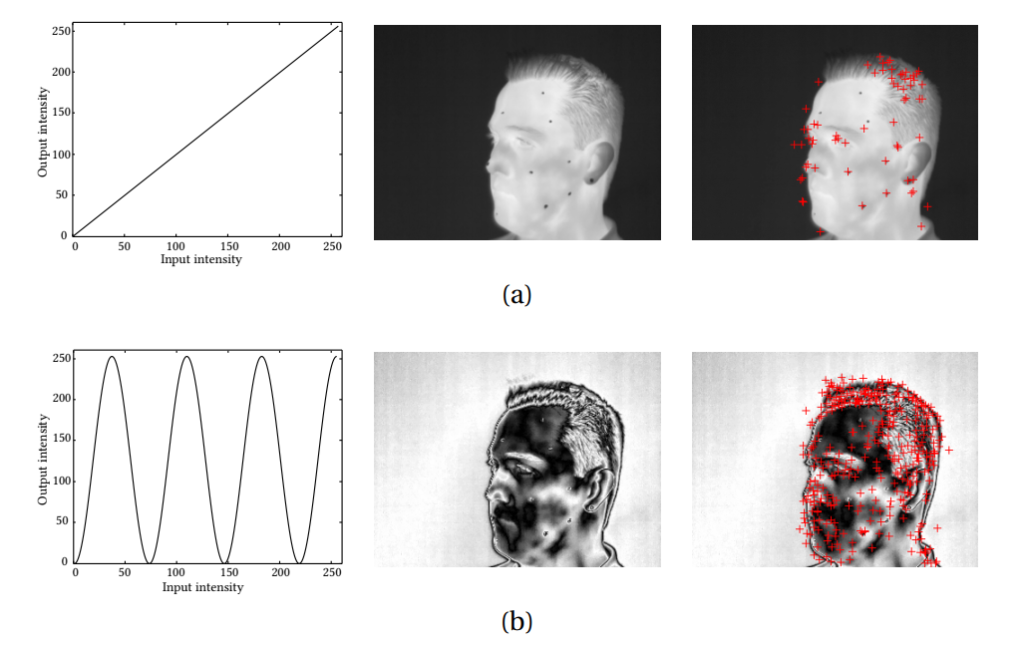
effect on matching, given that the created contrasts are consistent between different thermal images. Figure 3 shows the effect of the intensity transformation described by Equation 1 on a thermal image – it significantly increases the number of interest points detected.
The detection and description of interest points is done using the SIFT (Scale Invariant Feature Transform) method [30] through the SiftGPU software [31] and the VisualSFM interface [32]. The matching between interest points in the different images is made with the nearest point based on the Euclidean distance between their descriptors, that is, an interest point in an image is matched with the point in another image which minimizes the Euclidean distance between their
SIFT descriptors. The inconsistent matches are then filtered through RANSAC (Random Sample Consensus) [33].
With the set of consistent matches, it is possible to estimate the camera poses through Bundle Adjustment, using the Parallel Bundle Adjustment (PBA) software [34]. Additionally, it is possible to significantly improve the precision of pose estimation by incorporating the internal parameters of the camera – the intrinsic matrix K, described in Equation 2:
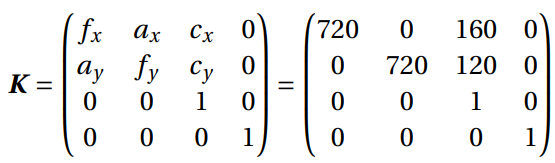
The matrix K is previously computed and is the same for all poses, since all thermal images were captured by the same camera. At last, determining the camera poses consists in the computation of the extrinsic matrix G, described by Equation 3:
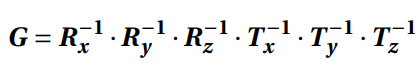
in which the matrices R-1 {x,y,z} and T-1{x,y,z} are, respectively, the inverses of the
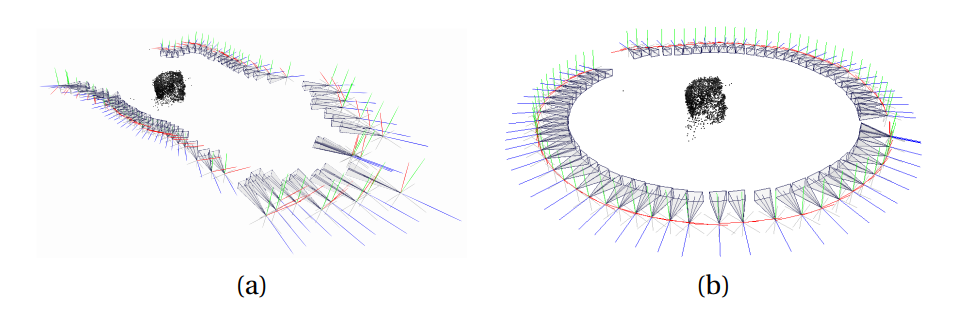
rotation and translation matrices in three dimensions. Figure 4 shows the pose estimation and the obtained sparse point cloud. Figures 4 (a) and (b) show the pose estimation without and with the previous calculation of the intrinsic matrix, respectively. Knowing that the swivel stand was used for acquisition of the thermal images and that the camera performed a circular movement around the subject, it is possible to notice that, with the intrinsic matrix, the real positioning of the camera is estimated much more accurately (Figure 4 (b)).
2.4. 3D Mesh Alignment
For an adequate projection of the thermal images onto the 3D mesh, the mesh must be aligned in the same plane of the camera. The desired alignment is the one that minimizes the overlap error between the thermal image and the twodimensional rendering of the 3D model. The rendering of the 3D model in a specific pose is determined by the transformation described in Equation 4:
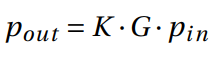
in which pin is a point in the model, K and G are the intrinsic and extrinsic matrices of the camera, respectively.
To determine overlap error, the rendering R of the 3D model and the thermal image T are thresholded to segment the object of interest, resulting in binary images RT and TT . The overlap error Err is the number of pixels that indicate the object in one of the images but not in both – the pixels in which the segmentation in the two images do not overlap, as described in Equation 5:
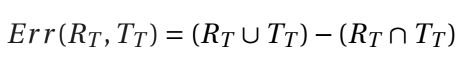
Figure 5 illustrates overlap error, in which red and orange pixels correspond to the segmentation of the object in the rendering of the 3D model and in the thermal image, respectively, while the white pixels indicate the overlap between the segmentation of both images. The error is the sum of the number of red and orange pixels.

From function Err, that measures the error (i.e. the quality of the alignment), the appropriate determination of the alignment can be modeled as an optimization problem. For its solution, Particle Swarm Optimization (PSO), which is a swarm-based metaheuristic algorithm [35], was adopted. The choice of this algorithm was motivated by the fact that it presents the shortest convergence time in the benchmark performed by Vesterstrom and Thomsen (2004) [36]. The PSO searches the solution space for a vector with seven elements related to the alignment of the 3D model, i.e. (x, y, z, θ, ρ, φ, s)T , the first three elements corresponding to position, the next three to rotation and the last one to scale.
At each iteration of the PSO, the overlap between the rendering of the 3D model with the thermal image is done for each of the 70 previously estimated poses (i.e. intrinsic and extrinsic matrices). The accumulated error for all poses characterizes the performance of the current alignment – PSO searches for the solution which minimizes this error.
2.5. Thermal Image Projection
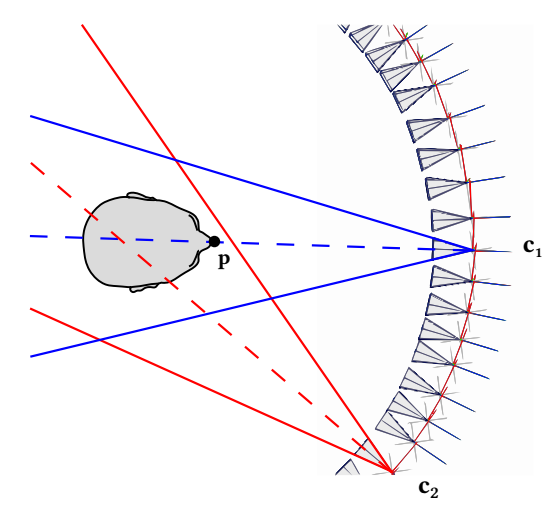
After aligning the 3D mesh, thermal images are projected onto its surface using the MeshLab software [37]. Due to the relatively large number of thermal images projected (i.e. 70), there is a significant number of superimpositions. Thus, the color value attributed to each point of the 3D model is a weighted average of these projections, in which the contribution of each thermal image is proportional to the distance of the camera to the point and of the point to the center of the image (Figure 6).
3. Heat Texture Test Object
A test object was designed to validate the general idea of the proposed approach, providing an approximation of “ideal” conditions. In addition to demonstrating that the proposed approach is feasible, it provides a baseline with which to compare the results obtained on the more difficult case of human subject data.
The validation of the proposed method requires a test object with the following requirements:
- The object must be three-dimensional: the aim of the proposed method is to combine a 3D model with thermal images, thus the test object must be a 3D object;
- The object must be capable of significant thermal emission: the aim of the proposed method is to combine a 3D model with thermal images, thus the test object must emit enough heat for it to be visible to the thermal camera;
- The object must be non-deformable: the shape of the object must be stable during the 3D model and thermal image acquisition, otherwise, it may not be possible to distinguish whether errors in the fusion were due to the quality of the data or the method;
- The object must have rich thermal texture: the proposed method depends on interest point detection using the SIFT method, which detects them as extrema in scale space. These extrema do not occur in homogeneous regions, thus a thermal texture is required for detection of an appropriate number of interest points.
A test object, called HTTO – Heat Texture Test Object, with the above described properties was assembled for validation of the proposed method. Its design is based on double layer fiberglass FR-4 printed circuit boards (PCBs) arranged as a parallelepiped. In each board, on the layer which is internal to the parallelepiped, PCB tracks were distributed in a closely spaced zigzag pattern (described in more detail below) to approximate an uniform thermal emission when powered. The layer on the exterior of the parallelepiped has a thermal marker texture, so that when the internal layer emits heat, it propagates through regions with only PCB fiberglass, while reflecting on regions with thermal marker, thus making a distinguishable pattern when viewed by a thermal camera. This double layer approach allows arbitrary textures, since the external layer does not need to conduct electricity.
3.1. Thermal Characteristics of PCB Elements
Before building the HTTO, a series of tests were performed in a double-layer fiberglass FR-4 PCB. The test board has an area of 15.2 cm × 10.1 cm, and copper layers with thickness of 35 μm. The layers of the board were divided into 9 regions, shown in Figure 7, with different thermal thermal conductor configurations and materials. The four regions dedicated to evaluation of the heating emission by different conductor configurations are labeled as R1, R7, R8 and R9 – implemented in a zigzag pattern, as illustrated in Figure 8. The considered configurations are: chessboard (each square has an area of 1 cm2), various and uniform (with and without silkscreen). Chessboard is used in several popular tools [38] that implement calibration techniques based on the study by Zhang [39]. Various and uniform are variations of the chessboard pattern.
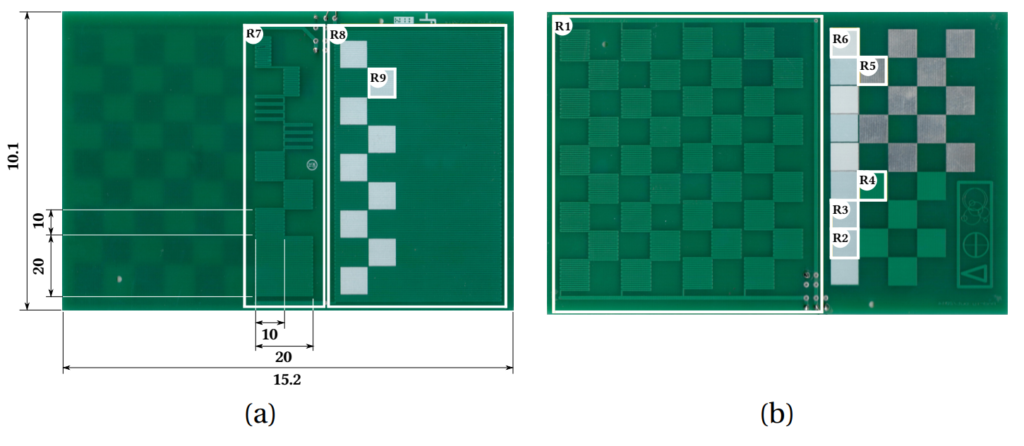
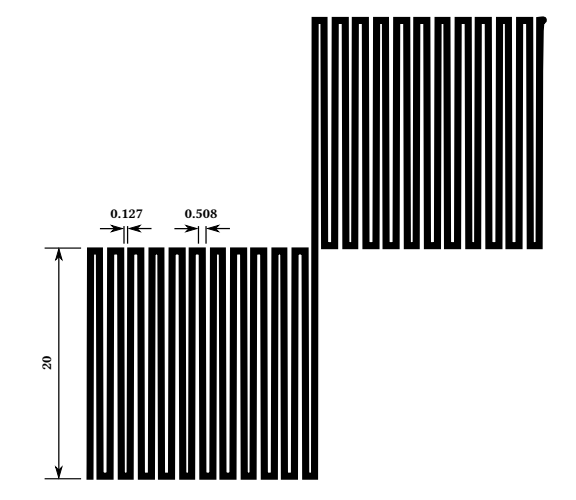
Table 1 presents the configurations in each region of the PCB. Regions dedicated to the evaluation of different combinations of materials are R2-R6, the combinations are described in Table 2. Only materials which are common in the manufacture of PCBs were considered (i.e. copper, tin-plating, varnish, silkscreen), allowing easy reproduction by usual manufacturing processes. The objective of this preliminary study was to determine the best track configurations and materials that provide an effective thermal marker for the HTTO.
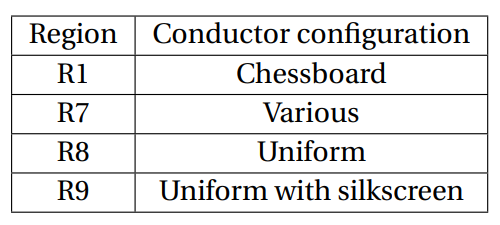
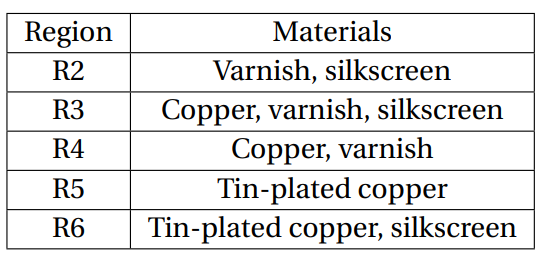
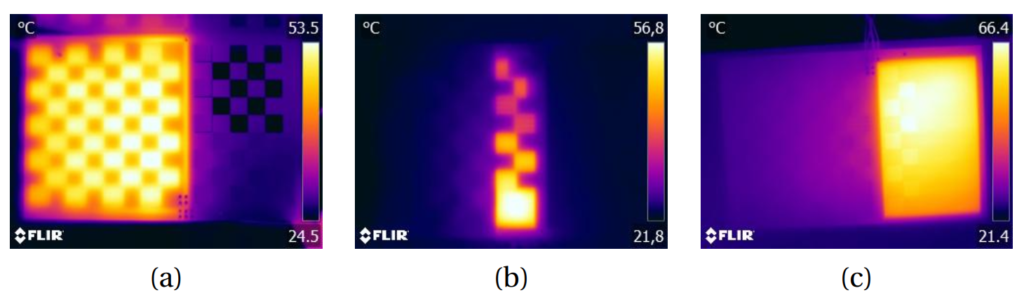
Figure 9 shows the thermal images of regions R1, R7, R8 and R9. The heating of the region R1 results in a blurred thermal image as can be seen in Figure 9 (a). The heating of region R7 , Figure 9 (b), shows that sparser patterns simply dissipate less heat, and the various configurations are not distinguishable. The evaluation of the thermal images of regions R8 and R9 were done by heating from region R8, since R9 is simply a subregion of R8 with an additional silkscreen coating. As can be seen in Figure 9 (c), there is no significant difference in the heat emission of a uniform region with or without silkscreen. There is heat concentration in the upper portion of region R8, which occurs due to the heat reflectivity of the chess pattern of region R5, on the opposite layer. This occurrence demonstrates that it is possible to heat the conductor even without the application of electric current on it, through the application of current in the
conductor on the opposite layer.
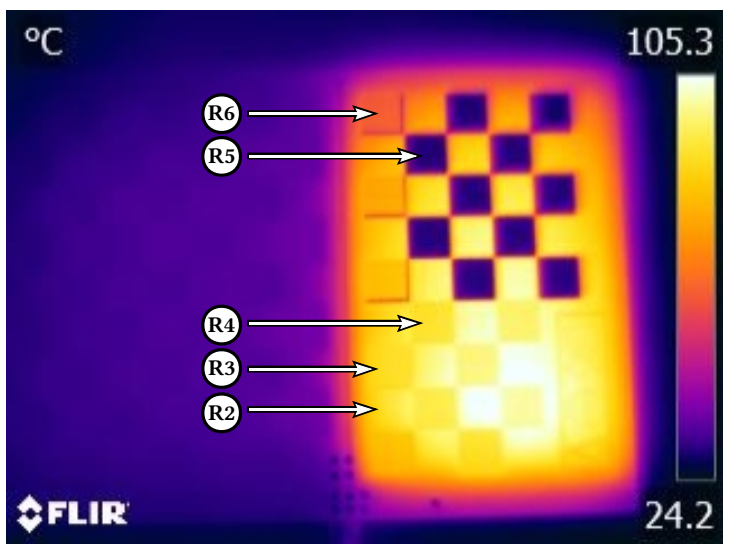
Regions dedicated to the evaluation of the different combinations of materials are R2-R6, the combinations are described in Table 2. Only materials which are common in the manufacture of PCBs were considered (i.e. copper, tin-plating, varnish, silkscreen), allowing easy reproduction by usual manufacturing processes. Figure 10 presents the thermal images of regions R1-R6, obtained with electrical current conduction on the opposite layer. The viability of this heating method was observed previously, during the evaluation of the electrical conductor configurations.
It is possible to note that, except for region R5, no combination of materials allows a well-defined identification of the pattern by the thermal camera. PCB fiberglass areas covered only by varnish dissipate heat, while areas covered only by tin-plated copper (i.e. R5) effectively block it, allowing a clear distinction between them. This result suggests that varnish causes significant heat distribution, interfering excessively in the distinction of the patterns by the thermal camera. The silkscreen interferes less than varnish, but only marginally (i.e. the region appears slightly darker), as can be seen by the heating in region R6. Thus, we consider the use of tin-plated copper as the most suitable for implementation of the thermal texture.
3.2. HTTO Design and Assembly
The HTTO was designed and assembled based on the thermal characteristics observed in the experiment described in the previous section. The specifications of the assembled object are presented below in terms of the requirements, which were presented previously, and the specifications that fulfill these requirements.
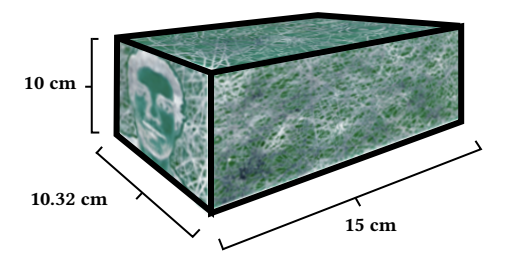
- The object must be three-dimensional: the PCBs that compose the test object were arranged in the form of a parallelepiped, with surface dimensions of 10×15 cm and 10×10.32 cm, as shown in Figure 11;
- The object must be capable of significant thermal emission: from the thermal characteristics observed in the experiments described in Section 3.1, tin-plated copper patterns were incorporated in the external layers of the PCBs, while the parallelepiped internal layers have a zigzag pattern of uniform conductor configuration. The zigzag tracks in the internal layer are electrically powered and effectively heat the surface of the object. As the frontal/posterior and lateral PCBs have different sizes, the electrical resistance of their tracks are also different. Considering this, the resistances of the tracks in each board were measured and they were powered with proportional voltages, so that they dissipate the same power and, consequently, have approximately the same temperature;
- The object must be nondeformable: the HTTO is composed of fiberglass (FR-4) boards affixed with silicone, presenting rigid structure;
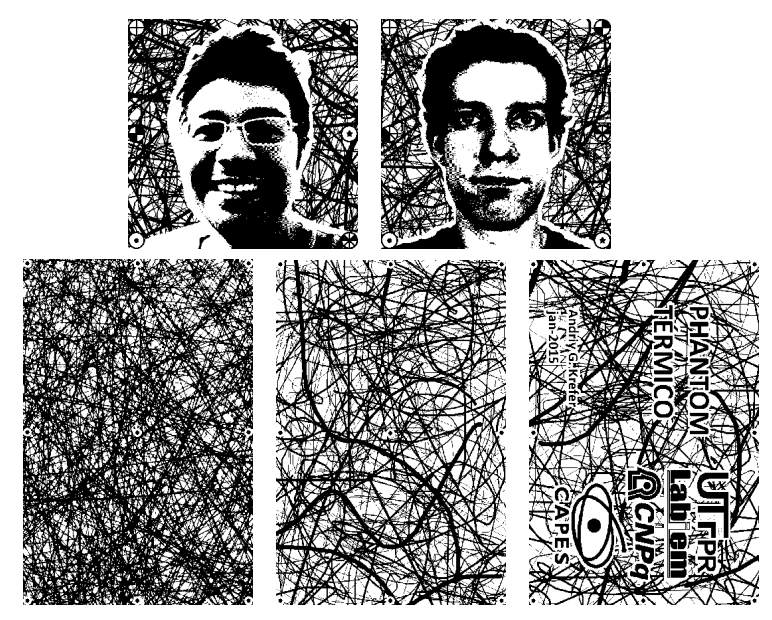
- The object must have rich textures thermal: dense and heterogeneous patterns of tin-plated copper have been elaborated for the external surface of the object. The patterns used in the manufacture of the PCBs are shown in Figure 12.
4. Results
In this section, the evaluation results of the proposed approach with the HTTO are presented. An assessment of the proposed intensity transformation is made on thermal images of human subjects, to quantify the increase in interest point detection and their robustness under different measurements. An assessment of 3D thermal models obtained with the proposed method on human subjects is also presented, in order to demonstrate its applicability under conditions similar to those present in medical applications.
4.1. Method Validation
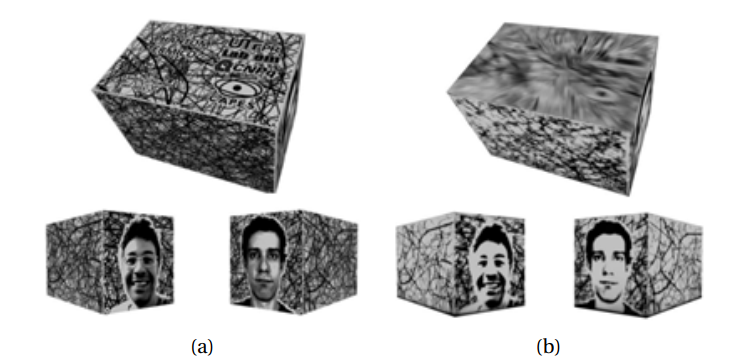
The method validation consists in assessing the displacement error between the manually projected reference, comprised of the images in Figure 12, and the automatically projected thermal images using the proposed method. Since the parallelepiped has flat sides, the error can be easily evaluated per-surface as the 2D error of the matched interest points themselves.
Figure 13 (a) shows the manual projection of the PCB layout, shown in Figure 12, over a parallelepiped 3D mesh. The simulated mesh has the HTTO specified dimensions. Figure 13 (a) is the measurement reference. Figure 13 (b) shows the thermal image projection over the same simulated mesh using the proposed method. The thermal projections around the sides of the mesh are close to the reference, but two aspects are noticeable. First, the top surface has a significantly distorted projection. This is consequence of the procedure adopted for thermal image acquisition, in which the camera translates around the test object over a single plane, causing occlusion in regions of the object that are not visible from the sides. Since this problem can be solved by acquisition of images at additional angles, we consider that it does not compromise the validity of the method, as it contemplates the possibility of such acquisitions using the mechanism described in Figure 2 – therefore the evaluation follows without considering the top surface of the HTTO (F5 in Figure 12). Second, the thermal texture presents less details than the PCB layout. This loss of fine detail is due to the low resolution of the thermal images (i.e. 320£240). Although this aspect impacts the interest point detection, it does not compromise the method because enough interest points are detected, albeit in reduced quantity. To illustrate this, the interest point detection, matching and filtering is presented in Figure 14.
In Figure 14, a series of incorrect matches can be noticed. They were already expected, as evidenced by experiments in stereoscopic vision and 3D reconstruction methods [33]. To address this the matches are filtered using RANSAC. Table 3 summarizes the results of the interest point detection and matching.
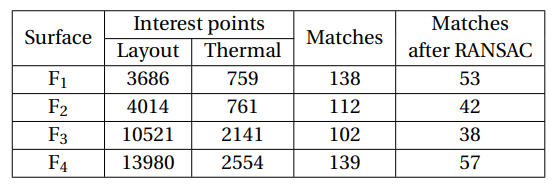
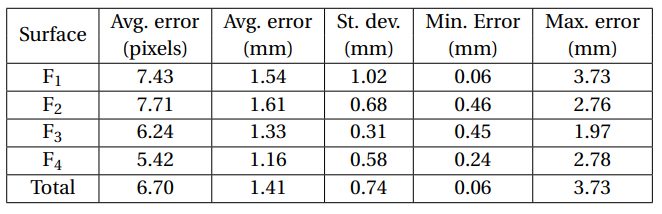
Considering that a significant number of interest point matches remain, the displacement error between the interest points can be evaluated. A summary of the displacement error for each surface of the HTTO is presented in Table 4, in which it is possible to notice that the method is accurate, with a maximum error of 3.73 mm.
4.2. Intensity Transformation
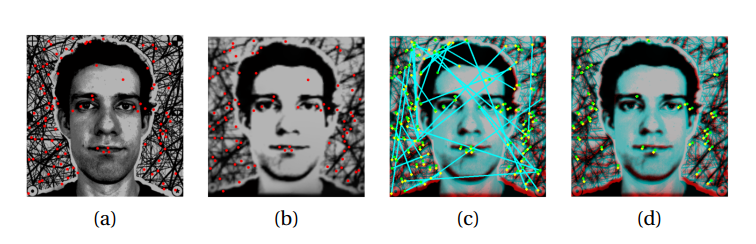
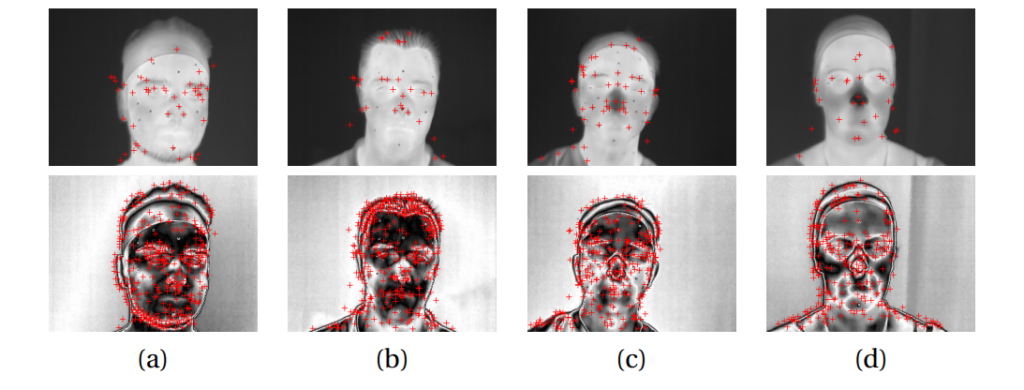
Recall that unlike the HTTO, which was designed to display rich thermal textures, human skin has a much more homogeneous aspect on thermal images. To address this, an intensity transformation was proposed (Equation 1), which significantly increases the number of interest points detected in such images. To illustrate the improvement resulting from this transformation, Figure 15 shows some examples of interest point detection on thermal images of the human subjects, without and with the transformation. For subjects S1-4, the intensity transformation increased the number of interest points detected approximately eight (from 54 to 434), ten (from 42 to 460), six (from 57 to 357), and nine (from 34 to 318) times, respectively.
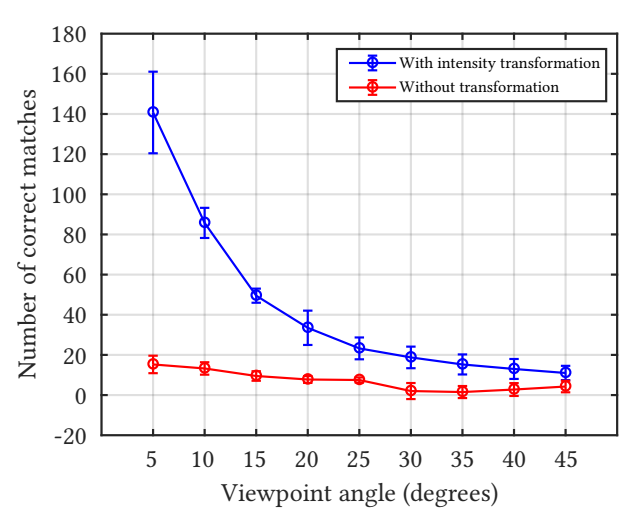
The robustness of the proposed intensity transformation was assessed in terms of number of correct matches under varying viewpoint angles. The reference image (i.e. viewpoint angle of 0º) corresponds to a frontal image of the face. Four sets of thermal images were acquired, with a delay of approximately three minutes between each set, to account for temperature variation under a time frame plausible for thermal image acquisition. There was a maximum variation of 3oC between the average temperature of the image sets. Figure 16 shows the results of the experiment with and without the transformation. The transformation clearly improves performance, very significantly. From the number of matches under a small viewpoint angle (e.g. 5º), it is possible to notice that the results from Figure 15 are indeed representative, since both indicate a performance increase of approximately ten times.
As expected, with the intensity transformation, the number of correct matches decreases rapidly with increasing viewpoint changes, which is reasonable, since the most distinctive (i.e. more stable keypoints are detected) regions of the head occur in the frontal view of the face. Without the transformation the decrease is more subtle, since there are almost no matches.
4.3. Case Study with Human Subjects
In order to demonstrate the use of the proposed method in medical applications, experiments were made with two human subjects. The simple geometry of the HTTO allowed evaluation on a per-surface basis. Additionally, the entire surface texture was a thermal marker by design, so that 2D displacement error between matching interest points could be used to estimate projection error. None of these is true for human subjects – markers must be manually placed for error measurement.
For each subject, markers that are both visually and thermally visible – fiducial markers – were placed on their faces during 3D mesh and thermal image acquisition, so that their displacement in the visible (i.e. mesh with visible light texture) and thermal 3D models could be measured at these locations. Note that the visible light texture is used only for evaluation, since the markers are not geometrically distinctive – the proposed method itself has no need for it. Moreover, the 3D thermography was restricted to the head, as it has representative applications such as in dentistry (e.g. temporomandibular disorders [40]) and facial recognition [19, 41].
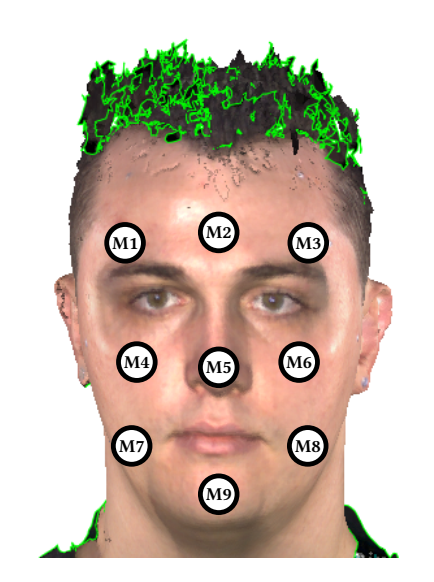
In each 3D model, nine markers were placed at the positions indicated in Figure 17. The displacement error of the markers was measured as their Euclidean distance, presented in Table 5.
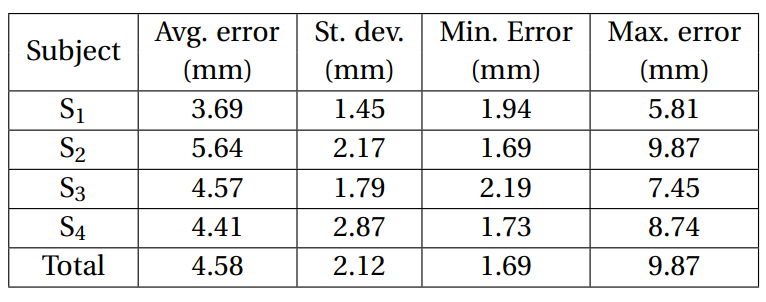
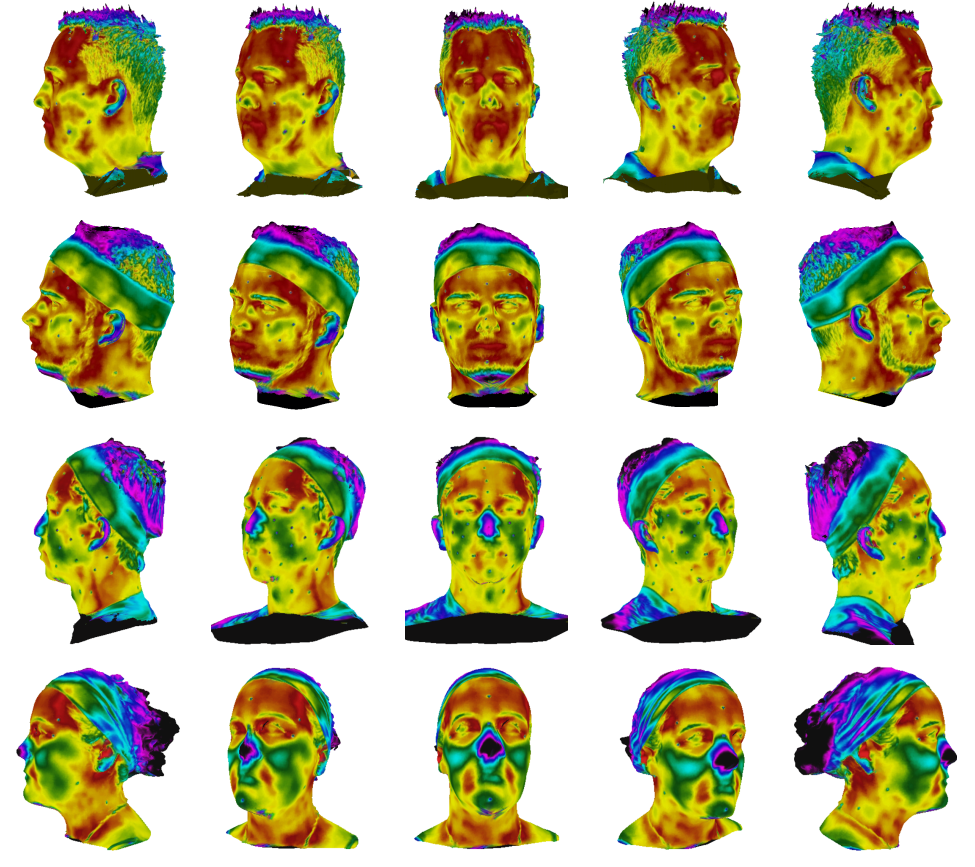
The average error (i.e. 4.58 mm) is reasonable, especially considering that the average head circumference of an adult male with average height (i.e. 1600 mm – 1800 mm) is approximately 600 mm [42], and that the markers themselves had a 3 mm diameter. The largest error (i.e. 9.87 mm) occurs in the marker on the nose of subject S2. It might seem like a large error compared to the maximum obtained with the HTTO, but considering that it accounts for three dimensions, unlike with the HTTO, in which the error is two-dimensional (it was accounted for each surface), it is reasonably small. Nevertheless, this error is not negligible and suggests that the simple weighted average approach described in Section 3 might be improved – even though it is enough to show the efficacy of the proposed method. Figure 18 shows, from different views, the 3D thermographs output by the proposed method. Overall, the results clearly show that the method is effective, despite the higher error compared to those observed in the evaluation with the HTTO.
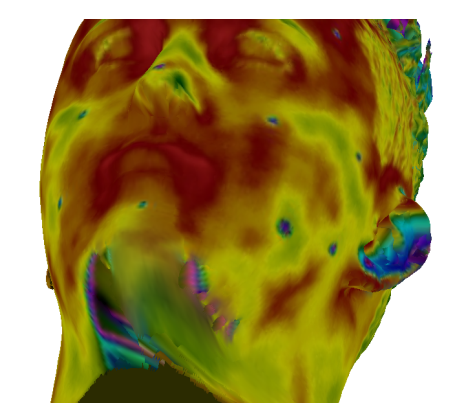
As discussed in the evaluation of the HTTO, there might be imperfections related to areas of occlusion that occur during the acquisition of the thermal images. This issue is noticeable, for instance, in the regions of the 3D thermal model corresponding to the chin of subject S1 (Figure 19). Again, these areas of occlusion are consequence of the circular motion of the thermal camera during thermal image acquisition. Because this motion is done in a single plane around the middle segment of the head, segments above and below are subject to occlusion. This issue can be solved simply by acquiring images at additional angles, i.e. varying h and γ in the swivel stand described in Figure 2.
5. Discussion
The analysis of displacement error showed that the proposed method is accurate under the simplified conditions provided by the HTTO. In this manner, it not only validates the general approach of the proposed method, but also provides a baseline for comparison of the results obtained with human subjects. Compared to using the HTTO, there are two main difficulties when employing the proposed approach on human subjects: poor contrast and significantly more complex geometry. To handle poor contrast, an intensity transformation was proposed, which was shown to increase very significantly the number of interest points detected. An assessment of the number of correct matches under varying viewpoint angles showed that the proposed transformation not only achieves consistently superior performance with respect to the original thermal images, but that it is robust under different measurements. Despite being more challenging, the more complex geometry did not compromise the process, since the local planarity of human faces were enough to detect an adequate number of stable interest points.
With an adequate number of stable interest points, camera pose estimation and 3D mesh alignment can be adequately employed for thermal image projection. The 3D thermal model resulting from this processing pipeline was shown to be accurate through an assessment of displacement error of fiducial markers. Taking the low resolution of the thermal images (i.e. 320×240) and diameter of the markers (i.e. 3 mm) into account, the errors are remarkably small. The projection might present some local errors under occluded regions (e.g. subject chin) of the thermal camera setup, but these can be mitigated by acquisitions of thermal images from additional angles.
Our approach differs from most other works that focus on biomedical applications, in which the common approach to compute 3D thermal models is to simultaneously acquire 3D geometry and 2D thermal data by affixing them together [17, 18, 20, 43]. In this case, thermal image projection into a 3D model is straightforward, since both imaging modalities are calibrated together. Some authors have even employed this approach for augmented reality, using a real projector to project thermal data over the physical object [44]. Our results show that such restrictive acquisition conditions can be avoided by employing pose estimation via Structure from Motion, as long as the thermal images are subject to an adequate intensity transformation.
A framework similar to ours was proposed in the context of Nondestructive Testing and Evaluation (NDT&E) applications by Akhloufi and Verney [45]. Their framework employs a projection of thermal data over a 3D height map, which relies on matching features over both imaging modalities. Since thermal data (and in this case, even the height map) have very low-contrast, the authors employ contrast stretching for dynamic range enhancement. In comparison, our work presents the following advantages. First, our approach does not rely on markers for feature detection. Fiducial markers are employed only for assessment of displacement error – the thermal image with intensity transformation is enough for feature detection. Second, our intensity transformation is capable of generating much more contrast than simple contrast stretching, so that the SIFT descriptor can be employed. This results in more robustness than the Hough transform employed by Akhloufi and Verney [45], which must assume the shape of the content to be detected. Additionally, their assessment is qualitative, while we provide a quantitative analysis in terms of amount and robustness of interest points detected, as well as displacement error in the thermal projection over the 3D mesh.
6. Conclusions
This paper presented a 3D thermography method that does not require coupled acquisition of 3D mesh and thermal images, unlike previous methods. Such decoupling allows more modular acquisition processes, which have advantages such as legacy equipment and data reuse. The method is based on camera pose estimation through Structure from Motion (SfM), which is widely employed for visible light images, but not so on thermal images. The issue with thermal images, namely, the lack of texture for adequate interest point detection, was addressed with an intensity transformation that increased the number of detections up to ten-fold in experiments with human subjects. For the validation of the proposed method, the design and implementation of the HTTO (Heat Texture Test Object) was presented. The HTTO can be easily reproduced with common printed circuit board manufacturing processes and can be used to evaluate other methods of 3D mesh and thermal image fusion. An evaluation of the proposed method on the HTTO showed that it is very accurate, resulting in an average displacement error of 1.41 mm (s = 0.74 mm). Additionally, the method was evaluated with human subjects in order to demonstrate its applicability under medical application conditions, resulting in an average displacement error of 4.58 mm (s = 2.12 mm), showing that the proposed method is also accurate with human subjects. Future work includes precise procedures to eliminate occlusion areas, improvement in the way the thermal projections are used (i.e. weighted average) to decrease displacement error, and evaluating the method with other interest point detectors and descriptors.
References
Deixe um comentário